Welcome to The ME2045 Group J Crane Project Blog page!


This entire site is to give a guide to Group J`s efforts to design a small portable crane for use in disaster relief before our final submission of work and our presentation.

Following our first meeting (See the Minute Meetings Topic for reference) the following positions have been allocated;

D.Scriven Project Manager
R.Sidhu Chief Designer
H.Singh Sall Finnance Officer
J.Sidhu Materials Specialist
R.Shukla Stress Analysis

For Our Progress up to date please see the Project Plan below and then head to the relevant topic and we hope you find our work interesting!

Showing posts with label Stress Analysis. Show all posts

Wednesday, 28 April 2010

Calculations For Buckling

Shown below are the calculations carried out to find out if the crane stucture would buckle and fail. The calculations were carried out on the members which would be likely to buckle under a compressive load.


The calculations prove that the members under compressive load would not buckle at 1.5 times the recommended lifting capacity.

Thursday, 22 April 2010

Finite Element Analysis of Final Design

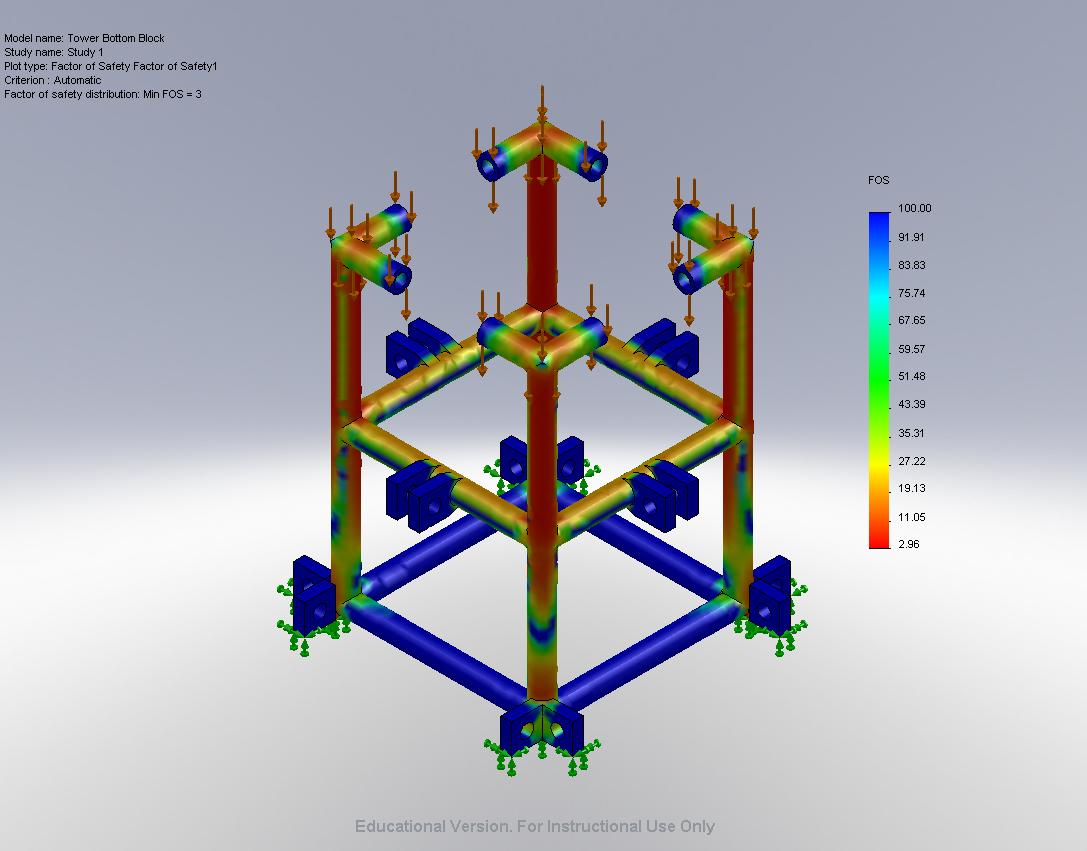
Shown below are images of the studies carried out on the final design CAD model. The following plots were created, so that we as a group could get an idea of how the crane would behave, when the load is applied. Each component of the crane was tested seperately. The axle, boom, legs, tower bottom block and the tower top block were tested. The plots created from left to right were displacement, factor of safety, strain and stress.

Axle
Material - Alloy Steel


Boom
Material - Alloy Steel


Leg
Material - Aluminium 6061 Alloy


Tower Bottom Block
Material - Aluminium 6061 Alloy


Tower Top Block
Material - Aluminium 6061 Alloy


The displacement plot shows us where the component would dimensionally change the most. All five of these displacement plots show that the dimensional change is within a tolerable region.

The Factor Of Saftey plot shows us whether the component is capable of carrying more load. All five of these plots show that the level of safety is within acceptable regions.

The strain plot shows us how the component would physically change under load. All five of these strain plots show that the physical change is within a tolerable region.

The stress plot shows us where on the componet the most stresses occur. All five of these stress plots show that the stress is within a tolerable region. This is because the stress does not go beyond the yield strength of the material.

Finite Element Analysis - Crane Boom Error

By carrying out a study on the crane boom we have found out that the structure is not rigid and strong enough to lift the load without plastically deforming. The image below shows how much the boom would deform when loaded.


The red arrow on the scale indicates the yield strength of the material, in this case aluminium 6061 alloy. Every stress above this arrow would plastically deform the component. In the case of this boom, the failure point would in the green and red areas. To prevent this the structure was further developed so that it became more rigid. The material was also changed to alloy steel. This material was chosen because it has a higher value yield stress and a higher Young's modulus. The image below shows how these changes made a significant improvement on the component.


The red arrow not being on the scale, indicates that the stresses do not reach the yield strength of the material and therefore does not plastically deform.